
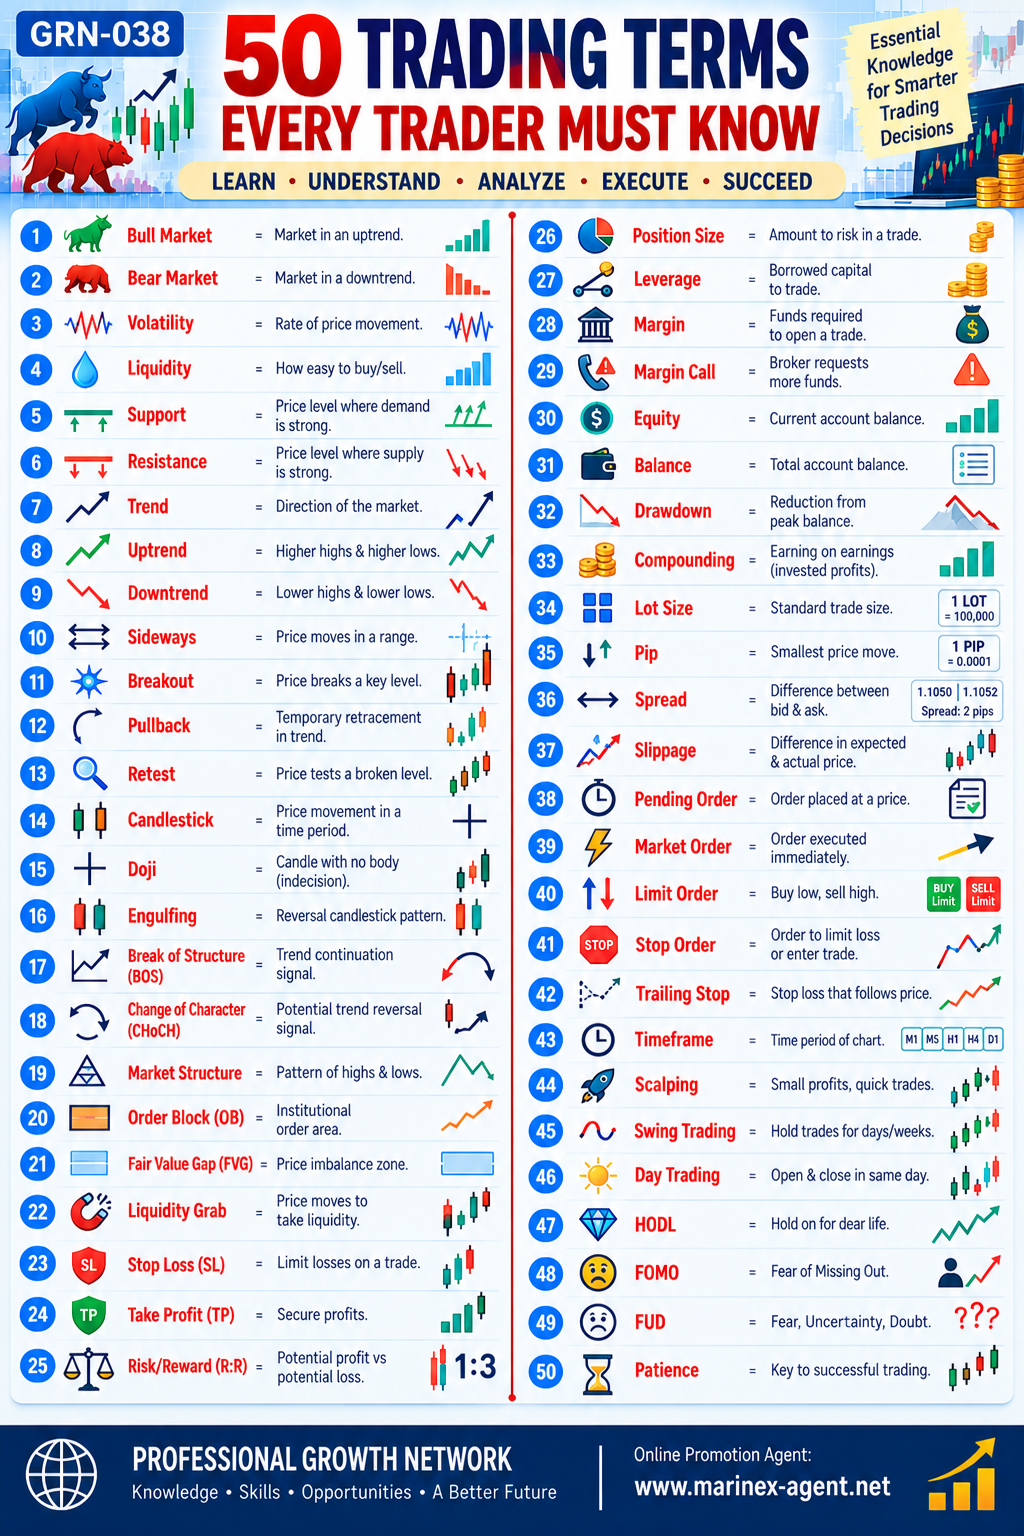
50 TRADING TERMS EVERY TRADER MUST KNOW
Parent Category: PROFESSIONAL GROWTH NETWORK
Category: Personal Growth & Self-Development
Article Code: GRN-038
LEARN • UNDERSTAND • ANALYZE • EXECUTE • SUCCEED
Introduction
Financial markets are an important part of the modern global economy.
Every day, millions of people participate in trading activities involving stocks, currencies, commodities, cryptocurrencies, bonds, and other financial instruments.
However, successful participation in financial markets requires more than simply buying and selling assets.
It requires an understanding of market terminology, price movements, technical analysis, risk management, trading psychology, and the mechanisms through which financial transactions are executed.
For beginners, unfamiliar trading terminology can make financial markets appear complicated.
The purpose of this article is to explain 50 essential trading terms in clear and practical English.
These terms are commonly used in stock trading, Forex, cryptocurrency markets, and other forms of financial trading.
By understanding them, readers can improve their financial literacy, interpret market information more confidently, and make better-informed decisions.
Important: This article is intended for educational purposes only. It does not constitute investment advice, a recommendation to trade, or a guarantee of financial success. Trading can result in substantial financial losses.
1. Bull Market
Definition: A market experiencing a sustained upward trend in prices.
A bull market is generally associated with increasing investor confidence, positive economic expectations, and growing demand for financial assets.
Practical Example
If a stock market index rises significantly over an extended period, analysts may describe the market as bullish.
Key Lesson: A bull market indicates generally positive market sentiment, but prices can still experience temporary declines.
2. Bear Market
Definition: A market experiencing a sustained downward trend in prices.
Bear markets are often associated with economic uncertainty, reduced investor confidence, and declining asset valuations.
Practical Example
A prolonged decline in major stock market indices may indicate a bear market.
Key Lesson: Bear markets require careful risk management because declining prices can continue longer than expected.
3. Volatility
Definition: The degree or rate of price movement in a financial market.
High volatility means prices fluctuate significantly, while low volatility indicates relatively smaller movements.
Practical Example
A cryptocurrency that rises 8% in one day and falls 10% the next is experiencing substantial volatility.
Key Lesson: Volatility creates trading opportunities but also increases potential financial risks.
4. Liquidity
Definition: How easily an asset can be bought or sold without significantly affecting its market price.
Highly liquid markets generally have many buyers and sellers.
Practical Example
Major currency pairs such as EUR/USD usually have substantial trading liquidity.
Key Lesson: Greater liquidity often supports faster transactions and narrower trading spreads.
5. Support
Definition: A price level or area where buying demand may be strong enough to slow or temporarily stop a decline.
Support is commonly identified through historical price behaviour.
Practical Example
If a stock repeatedly stops falling near $50, traders may identify that area as a support level.
Key Lesson: Support is a potential price zone, not a guaranteed barrier against further declines.
6. Resistance
Definition: A price level or area where selling pressure may be strong enough to slow or temporarily stop an increase.
Practical Example
If a stock repeatedly struggles to rise above $100, that price may be considered resistance.
Key Lesson: Resistance can influence trading decisions, but prices may eventually break above it.
7. Trend
Definition: The general direction of market prices over a particular period.
A trend can be upward, downward, or sideways.
Practical Example
A stock that gradually increases in price over several months may be following an upward trend.
Key Lesson: Identifying market trends is a fundamental part of technical analysis.
8. Uptrend
Definition: A market movement characterized by generally higher highs and higher lows.
An uptrend indicates that prices are moving upward over the selected timeframe.
Practical Example
A stock rises from $40 to $50, retreats to $46, and subsequently advances to $58.
Key Lesson: Uptrends suggest buying strength, although temporary corrections remain possible.
9. Downtrend
Definition: A market movement characterized by generally lower highs and lower lows.
Practical Example
A stock declines from $100 to $85, rebounds to $92, and then falls to $75.
Key Lesson: Downtrends indicate selling pressure and require caution when considering purchases.
10. Sideways Market
Definition: A market in which prices move within a relatively stable trading range.
Neither buyers nor sellers establish a sustained directional trend.
Practical Example
A stock repeatedly fluctuates between $45 and $50 without moving significantly beyond those levels.
Key Lesson: Sideways markets are often described as consolidation or range-bound conditions.
11. Breakout
Definition: A price movement beyond an established support, resistance, or other important technical level.
Practical Example
A stock trading below $100 for several weeks rises above $100.
Traders may describe this movement as a breakout.
Key Lesson: Not every breakout develops into a sustained trend; false breakouts are common.
12. Pullback
Definition: A temporary price movement against the prevailing market trend.
Practical Example
During an uptrend, a stock rises from $70 to $90 and temporarily declines to $84 before potentially continuing higher.
Key Lesson: A pullback does not necessarily mean that the main trend has ended.
13. Retest
Definition: When a price returns to a previously broken technical level.
Traders sometimes monitor retests to evaluate whether former resistance may act as support, or former support may act as resistance.
Practical Example
A stock breaks above $60 and later declines toward $60 again.
Key Lesson: Retests can provide additional information about market behaviour, but they do not guarantee future price direction.
14. Candlestick
Definition: A graphical representation of price movement during a selected period.
A candlestick commonly displays four prices:
- Open.
- High.
- Low.
- Close.
Practical Example
A daily candlestick shows how a stock traded from the opening to the closing of one trading session.
Key Lesson: Candlestick charts help traders visualize price behaviour.
15. Doji
Definition: A candlestick pattern in which the opening and closing prices are identical or very close.
A Doji may indicate uncertainty or a temporary balance between buyers and sellers.
Practical Example
A stock opens at $100 and closes near $100 despite significant movement during the session.
Key Lesson: A Doji is not automatically a reversal signal; its meaning depends on market context.
16. Engulfing Pattern
Definition: A two-candlestick formation in which the second candle’s real body engulfs the previous candle’s real body.
Common variations include bullish and bearish engulfing patterns.
Practical Example
A large bullish candle follows a smaller bearish candle and completely covers its real body.
Key Lesson: Engulfing patterns are studied as possible reversal signals, but they require additional confirmation.
17. Break of Structure (BOS)
Definition: A technical-analysis concept describing a price movement beyond a previous significant swing high or swing low.
In certain trading methodologies, BOS is interpreted as confirmation of trend continuation.
Practical Example
During an uptrend, the price breaks above its previous important high.
Key Lesson: BOS is a chart-analysis interpretation, not a guarantee that the trend will continue.
18. Change of Character (CHoCH)
Definition: A technical-analysis term describing a possible change in the established pattern of price movement.
It is commonly used to identify a potential shift in market direction.
Practical Example
During a downtrend, the price begins breaking above important previous swing highs.
Key Lesson: CHoCH may suggest a developing reversal, but false signals can occur.
19. Market Structure
Definition: The overall arrangement of price highs, lows, trends, and trading ranges.
Market structure helps analysts describe how prices are behaving.
Practical Example
Higher highs and higher lows may indicate bullish market structure.
Key Lesson: Understanding market structure provides context for other technical indicators.
20. Order Block (OB)
Definition: In certain technical-analysis methodologies, a price area interpreted as being associated with significant institutional buying or selling activity.
Practical Example
A trader identifies a price zone preceding a strong upward movement and labels it a bullish order block.
Key Lesson: Order blocks are interpretive chart concepts; the presence of institutional orders cannot normally be verified from a price chart alone.
21. Fair Value Gap (FVG)
Definition: A price imbalance identified in certain technical-analysis methods, often using a three-candlestick pattern.
A Fair Value Gap may indicate an area where price moved rapidly with relatively limited overlap between candles.
Practical Example
A sharp upward price movement leaves a gap-like zone between parts of the first and third candles.
Key Lesson: Prices do not always return to Fair Value Gaps, and such patterns do not guarantee profitable trades.
22. Liquidity Grab
Definition: A trading term describing a price movement that passes through a level where many orders may be concentrated, sometimes followed by a reversal.
Practical Example
A price briefly moves below an established support level and then returns above it.
Key Lesson: Liquidity-grab interpretations should be treated cautiously because the underlying order activity may not be directly observable.
23. Stop Loss (SL)
Definition: An order or instruction intended to close a position when the market reaches a specified adverse price level.
Stop-loss orders are widely used to manage trading risk.
Practical Example
A trader buys a stock at $100 and places a stop-loss order at $95.
Key Lesson: A stop loss can help limit losses, but execution prices may differ from the specified level during gaps or fast-moving markets.
24. Take Profit (TP)
Definition: An order or instruction intended to close a position when a specified favourable price level is reached.
Practical Example
A trader buys an asset at $100 and establishes a take-profit level at $115.
Key Lesson: Take-profit orders can support disciplined trading, although the selected target may never be reached.
25. Risk/Reward Ratio (R)
Definition: A comparison between the potential financial loss and the potential financial gain of a trade.
Practical Example
A trade has:
- Potential loss: $100.
- Potential profit: $300.
- Risk/Reward Ratio: 1:3.
Key Lesson: A favourable risk/reward ratio does not guarantee profitability. The probability of winning, transaction costs, and execution quality also matter.
26. Position Size
Definition: The quantity of a financial instrument held or traded.
Position size determines the extent of market exposure and influences the potential gain or loss.
Practical Example
Purchasing 100 shares represents a larger position than purchasing 10 shares of the same stock.
Key Lesson: Position sizing is a fundamental part of trading risk management.
27. Leverage
Definition: The use of borrowed funds or financial exposure that exceeds the trader’s own committed capital.
Leverage can magnify both gains and losses.
Practical Example
With 10:1 leverage, a trader may control a position worth $10,000 using approximately $1,000 in margin, depending on the product and broker’s requirements.
Key Lesson: Leverage substantially increases financial risk and can lead to rapid losses.
28. Margin
Definition: Funds or collateral required to open and maintain a leveraged trading position.
Margin requirements depend on the financial instrument, broker, and applicable regulations.
Practical Example
A broker requires $1,000 in margin to establish a leveraged position.
Key Lesson: Margin is collateral, not the maximum amount a trader can lose.
29. Margin Call
Definition: A notification or requirement from a broker when account equity or available collateral falls below specified requirements.
Practical Example
A leveraged position loses value, and the broker requires additional funds or a reduction in exposure.
Key Lesson: Depending on the account agreement and regulations, brokers may liquidate positions without waiting for additional funds.
30. Equity
Definition: The current net value of a trading account, including unrealized gains and losses on open positions.
Practical Example
An account has a balance of $5,000 and an unrealized loss of $300.
Current Equity: $4,700.
Key Lesson: Equity reflects the changing value of the trading account while positions remain open.
31. Balance
Definition: The amount recorded in a trading account after completed transactions, deposits, withdrawals, and applicable charges, excluding unrealized gains or losses.
Practical Example
An account has $5,000 in realized funds and an open position showing an unrealized profit of $200.
The balance may remain $5,000 while equity is approximately $5,200.
Key Lesson: Balance and equity are different measurements.
32. Drawdown
Definition: The decline in an account’s or investment’s value from a previous peak to a subsequent lower value.
Practical Example
An account reaches $10,000 and later falls to $8,000.
The drawdown is $2,000, or 20%.
Key Lesson: Monitoring drawdown helps evaluate trading risk and capital preservation.
33. Compounding
Definition: The process through which investment returns generate additional returns when earnings are reinvested.
Practical Example
An investment of $1,000 earns 5%, increasing its value to $1,050.
If another 5% return is earned on the new value, the investment grows to $1,102.50.
Key Lesson: Compounding can support long-term growth, but negative returns can also compound losses.
34. Lot Size
Definition: A standardized quantity used when trading certain financial instruments.
In Forex, a standard lot commonly represents 100,000 units of the base currency.
Practical Example
One standard lot of EUR/USD generally represents 100,000 euros of base-currency exposure.
Key Lesson: Lot sizes differ across markets and products. Always verify the contract specifications.
35. Pip
Definition: A conventional unit used to measure small price movements in Forex trading.
For many major currency pairs, one pip equals 0.0001.
For certain pairs involving the Japanese yen, one pip is commonly 0.01.
Practical Example
EUR/USD moves from 1.1000 to 1.1005.
The movement equals five pips.
Key Lesson: Pip value in money depends on position size, currency pair, and account currency.
36. Spread
Definition: The difference between the bid price and the ask price of a financial instrument.
The bid is generally the price at which a trader can sell, while the ask is the price at which a trader can buy.
Practical Example
- Bid: 1.1050.
- Ask: 1.1052.
- Spread: 0.0002, or two pips for EUR/USD.
Key Lesson: The spread is an important component of trading costs.
37. Slippage
Definition: The difference between the expected execution price and the actual execution price.
Slippage can occur when prices move before an order is executed.
Practical Example
A trader expects to buy at $50 but receives an execution price of $50.20.
Key Lesson: Slippage can be favourable or unfavourable and is particularly relevant in volatile or illiquid markets.
38. Pending Order
Definition: An instruction submitted for possible execution at a later time when specified conditions are met.
Pending orders may include limit orders, stop orders, and other conditional order types.
Practical Example
A trader places an instruction to buy a stock if its price reaches a particular level.
Key Lesson: Pending orders allow trading conditions to be established in advance.
39. Market Order
Definition: An instruction to buy or sell a financial instrument as promptly as possible at available market prices.
Practical Example
A trader submits a market order to purchase 50 shares.
Key Lesson: Market orders generally prioritize execution rather than a guaranteed price.
40. Limit Order
Definition: An instruction to buy or sell at a specified price or better.
Practical Example
A trader places a buy limit order at $90 while the market price is $95.
The order may execute if suitable selling liquidity becomes available at $90 or below.
Key Lesson: Limit orders provide price control but do not guarantee execution.
41. Stop Order
Definition: An order activated when the market reaches a specified stop price.
A stop order may be used to enter a position or to exit an existing position.
Practical Example
A trader places a sell stop order below the current market price to manage downside exposure.
Key Lesson: Once triggered, a standard stop order generally becomes a market order, so the final execution price may differ from the stop price.
42. Trailing Stop
Definition: A stop order designed to adjust automatically when the market moves favourably by a specified amount or percentage.
Practical Example
A trader sets a trailing stop $5 below the highest market price reached after entering a long position.
As the market rises, the stop level may move upward.
Key Lesson: Trailing stops can help protect gains, but they cannot guarantee a particular exit price.
43. Timeframe
Definition: The period represented by each candlestick, bar, or other unit on a trading chart.
Common timeframes include:
- One minute.
- Five minutes.
- One hour.
- Four hours.
- One day.
- One week.
Practical Example
A daily candlestick chart displays one trading day’s price movement per candle.
Key Lesson: The same asset may display different trends across different timeframes.
44. Scalping
Definition: A short-term trading strategy involving frequent transactions intended to capture relatively small price movements.
Practical Example
A trader enters and exits several positions within minutes.
Key Lesson: Scalping requires careful attention to transaction costs, execution speed, and risk. It can be particularly demanding for inexperienced traders.
45. Swing Trading
Definition: A trading approach in which positions are commonly held for several days or weeks to capture broader price movements.
Practical Example
A trader buys a stock expecting a price movement over the following two weeks.
Key Lesson: Swing trading involves overnight and potentially weekend market risks.
46. Day Trading
Definition: A trading approach in which positions are opened and closed within the same trading day.
Practical Example
A trader purchases shares in the morning and sells them before the trading session ends.
Key Lesson: Day trading is demanding, and frequent trading can produce substantial costs and losses.
47. HODL
Definition: A cryptocurrency community expression referring to holding digital assets rather than selling them during market fluctuations.
The term originated from a misspelling of the word “hold.”
Practical Example
A cryptocurrency investor decides to retain an asset despite substantial short-term price volatility.
Key Lesson: Holding an asset for a long period does not guarantee appreciation or recovery from losses.
48. FOMO — Fear of Missing Out
Definition: The anxiety that others are benefiting from an opportunity that one has not yet taken.
In trading, FOMO can encourage impulsive purchases after substantial price increases.
Practical Example
A trader buys an asset simply because its price has risen rapidly and many people are discussing it.
Key Lesson: Emotional pressure should not replace independent analysis.
49. FUD — Fear, Uncertainty, and Doubt
Definition: A combination of negative emotions or messaging that can influence market sentiment.
FUD may arise from legitimate concerns, misinformation, rumours, or deliberately misleading claims.
Practical Example
Unverified rumours about a financial institution cause market participants to sell assets rapidly.
Key Lesson: Verify information before making financial decisions.
50. Patience
Definition: The ability to wait, evaluate conditions, and avoid unnecessary trading decisions.
Patience is often considered an important element of trading discipline.
Practical Example
A trader decides not to enter a position because market conditions do not meet a predefined strategy.
Key Lesson: Sometimes the most responsible trading decision is not to trade.
51. Understanding the Relationship Between Trading Terms
The 50 terms described above can be organized into several practical groups.
A. Market Conditions
These terms describe the general behaviour of financial markets:
- Bull Market.
- Bear Market.
- Volatility.
- Liquidity.
- Trend.
- Uptrend.
- Downtrend.
- Sideways Market.
Understanding market conditions helps traders recognize the environment in which decisions are being made.
B. Technical Analysis
These terms help describe price charts and possible trading patterns:
- Support.
- Resistance.
- Breakout.
- Pullback.
- Retest.
- Candlestick.
- Doji.
- Engulfing.
- Break of Structure.
- Change of Character.
- Market Structure.
- Order Block.
- Fair Value Gap.
- Liquidity Grab.
Technical analysis is an interpretive tool and cannot reliably predict every market movement.
C. Risk and Capital Management
These terms concern financial exposure and the management of potential losses:
- Stop Loss.
- Take Profit.
- Risk/Reward Ratio.
- Position Size.
- Leverage.
- Margin.
- Margin Call.
- Equity.
- Balance.
- Drawdown.
- Compounding.
- Lot Size.
Risk management is one of the most important subjects for anyone studying trading.
D. Order Execution
These terms explain how transactions are submitted and processed:
- Pip.
- Spread.
- Slippage.
- Pending Order.
- Market Order.
- Limit Order.
- Stop Order.
- Trailing Stop.
Understanding order execution helps traders recognize the difference between intended and actual transaction results.
E. Trading Strategies and Psychology
These terms concern trading methods and behavioural discipline:
- Timeframe.
- Scalping.
- Swing Trading.
- Day Trading.
- HODL.
- FOMO.
- FUD.
- Patience.
Emotional discipline is essential because impulsive decisions can undermine even a carefully prepared trading plan.
52. Ten Essential Rules for Responsible Trading
Learning terminology is only the beginning.
Anyone considering participation in financial markets should understand the importance of responsible financial behaviour.
Rule 1 — Learn Before You Trade
Study market structure, financial instruments, transaction costs, and basic risk management before committing real money.
Rule 2 — Understand the Financial Instrument
Stocks, currencies, futures, options, and cryptocurrencies have different characteristics and risks.
Rule 3 — Protect Your Capital
Avoid risking money needed for housing, food, healthcare, education, or other essential expenses.
Rule 4 — Be Extremely Careful With Leverage
Leverage can magnify losses and, depending on the product and account protections, may expose traders to losses beyond their initial deposit.
Rule 5 — Use a Clear Trading Plan
A trading plan should define objectives, acceptable risks, position sizes, and conditions for entering or exiting positions.
Rule 6 — Understand Trading Costs
Consider spreads, commissions, financing charges, and possible slippage.
Rule 7 — Avoid Emotional Decisions
Do not trade simply because of fear, excitement, social media rumours, or pressure from others.
Rule 8 — Verify Information
Use reliable financial information and understand the limitations of forecasts and technical indicators.
Rule 9 — Evaluate Your Results
Maintain accurate records of transactions, expenses, gains, losses, and trading decisions.
Rule 10 — Recognize When Not to Trade
Financial markets will continue to offer opportunities, but no individual is required to participate in every price movement.
The preservation of financial capital should take priority over speculative excitement.
53. The Role of Financial Literacy in Personal Growth
Financial literacy is an important part of personal development.
It helps individuals understand how money, financial institutions, investments, credit, and economic markets operate.
However, financial literacy should not be confused with active trading.
A person can become financially knowledgeable without engaging in short-term speculation.
Important Areas of Financial Education
- Personal budgeting.
- Savings and emergency funds.
- Debt management.
- Retirement planning.
- Investment fundamentals.
- Financial market terminology.
- Risk management.
- Consumer financial protection.
- Fraud prevention.
- Long-term financial planning.
For many individuals, developing these skills may provide greater practical value than attempting frequent speculative trading.
54. PROFESSIONAL GROWTH NETWORK — Knowledge Creates Opportunities
The PROFESSIONAL GROWTH NETWORK (PGN) promotes education, practical skills, professional development, and international cooperation.
Our objective is to help people improve their knowledge and identify opportunities for personal and business growth.
Financial literacy is one of the important subjects within this broader educational mission.
Through articles such as GRN-038 — 50 TRADING TERMS EVERY TRADER MUST KNOW, readers can become more familiar with financial terminology and develop a better understanding of modern economic systems.
The purpose is not to encourage unnecessary speculation.
Instead, we aim to support informed thinking, responsible financial behaviour, and continuous education.
Our broader professional development principle remains:
First Promote Yourself — Then Promote the Products and Services You Represent.
Through Marinex-Agent — Your Personal Online Promotion Agent, we also encourage entrepreneurs and professionals to strengthen their digital presence and establish new international business contacts.
Conclusion
Understanding financial terminology is an important first step toward improving financial literacy.
The 50 trading terms presented in this article explain how markets move, how technical analysts interpret price behaviour, how orders are executed, and how traders evaluate potential risks.
They also demonstrate the importance of discipline, patience, and careful financial planning.
However, knowing trading terminology does not automatically make someone a successful trader.
Financial markets are uncertain, and even experienced professionals can experience significant losses.
Knowledge reduces confusion, but it does not eliminate financial risk.
For the PROFESSIONAL GROWTH NETWORK, the central lesson is simple:
LEARN → UNDERSTAND → ANALYZE → EXECUTE RESPONSIBLY → CONTINUE LEARNING
Financial education should help individuals make informed decisions, protect their resources, and develop a more secure long-term financial future.
Further Reading
- U.S. Securities and Exchange Commission — Investor.gov: https://www.investor.gov/
- FINRA — Investor Education: https://www.finra.org/investors
- CME Group — Education: https://www.cmegroup.com/education.html
- CFTC — Learn and Protect: https://www.cftc.gov/LearnAndProtect/
PROFESSIONAL GROWTH NETWORK
Knowledge • Skills • Opportunities • A Better Future
Online Promotion Agent: https://www.marinex-agent.net